My photo
I'm an illustrator and book designer located in Holyoke, MA. Contact me for commissions or with questions at sargetsinger@gmail.com. Visit my website: sophieargetsinger.com

Tuesday, May 5, 2020

Web Map Portfolio


Points of Interest at the Nan Williams Conservation Area. Constructed with ArcGIS Online.


Rare Species of Mt. Tom Story Map.  Constructed with ArcGIS Online.


Holyoke Spatial Analysis Story Map.  Constructed with ArcGIS Online.


Rochester Schools Google Map.  Constructed with code.


Priority Habitats in Franklin County.  Constructed with a modified Mapbox template (Outdoors) and code.


Flight of the Double Eagle II. Constructed in Mapbox using the Monochrome Light template and code.
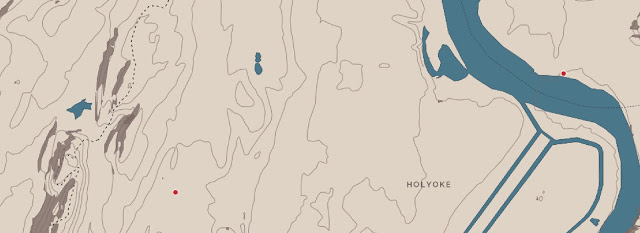

Dinosaurs in Hampden County.  Constructed in Mapbox with custom design and code.
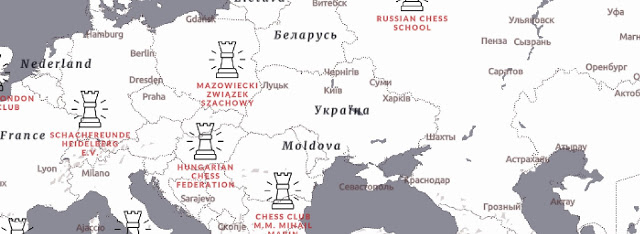

Chess Centers around the World.  Constructed in Mapbox with custom design and code.
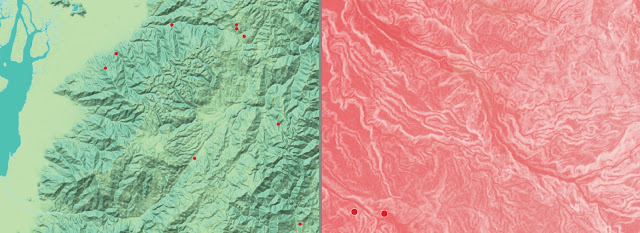

Glass Frog Occurrences.  Constructed in Mapbox with custom design and code.
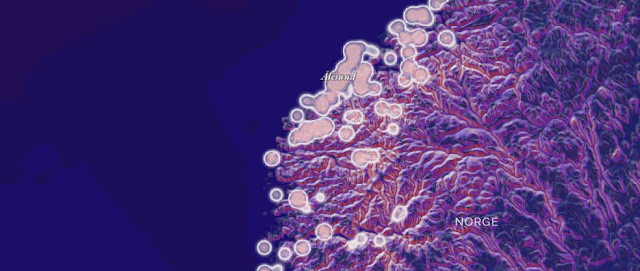

Lion's Mane Jellyfish Occurrences.  Constructed in Mapbox with custom design and code.


Wednesday, April 22, 2020

Map Design Resource Library

I've always been interested in maps and geography, but have found cartography and the design and constructions of maps to be a mysterious subject, and a difficult world to enter independently. Unexpectedly, returning to school to study plants and get a science degree has opened up the world of map design and construction to me. Through classes taken with Forrest Bowlick, I've been able to test the waters a bit in the world of cartography over the past couple of years, and have gained some insight into how maps are produced by professionals.

I've particularly found Mapbox to be a really amazing tool for designing maps. Here are some of my Mapbox experiments (click a map name to go to the full map):


Dinosaur map


Chess map


Frog map

 
Lion's mane jellyfish map

Below is a list of some of the tools and resources that I've come across and found useful for making good-looking maps, a subject that I'm hoping to continue to explore!


DATA 


Natural Earth
Natural Earth is a public domain dataset of vector and raster data available at various scales (including small scales). Data is ready-to-use with neat, generalized linework, and has embedded GIS attributes.

Data World
Search for datasets on any imaginable topic here.


GBIF
The Global Biodiversity Information Facility “is an international network and research infrastructure funded by the world's governments and aimed at providing anyone, anywhere, open access to data about all types of life on Earth.”


TOOLS 


Contours
A web tool that you can use to generate elevation contours for anywhere in the world, and style and download them.

Color Brewer

A web tool for selecting colors for maps. You can filter color schemes for color-blind safeness and export colors into Illustrator, Photoshop, or Excel.

Color Dot
A fun, interactive color explorer.

Color Oracle
A color blindness simulator that shows you in real time what people with color vision impairments will see when they look at your design.

The Noun Project
A database of 2 million+ downloadable icons created by a global community.

Maki
An icon set made by Mapbox for map designers.


TUTORIALS & DESIGN SUPPORT


Map box Tutorials (@mapbox)
Step-by-step guides for navigating the world of Mapbox, including 11 tutorials on map design.

Mapbox Webinars
Mapbox has been offering weekly “lunchbox” live webinars on topics like adding points with Google sheets, APIs, Mapbox Atlas, story maps, etc.

Mapbox Styling Webinar (Jonathan Walker)
(@jonni_walker)
An excellent webinar focusing on styling suggestions and techniques to use in Mapbox, with demos on building a map style from scratch.

Map Practical (Kevin McManigal)
This blog has some good YouTube tutorials and tips focused on using Illustrator and ArcMap to create good-looking maps. Topics include Illustrator basics, tracing in Illustrator, contour masks in Illustrator, and building custom shaded relief in ArcMap.

Andy Woodruff  
(@awoodruff)
Andy Woodruff is a developer and cartographer with Axis Maps 
(@axismaps). His website has very cool examples of maps he’s constructed, most with interactive notebooks (with code) and explanations of how the maps were made.

Desktop Style Cartography with Web Graphics (Andy Woodruff)
Andy Woodruff gave a talk at the 2019 North American Cartographic Information Society conference on using code as a design tool for web maps. Here you can view the slides from his talk and look at tutorials and examples.

Incorporating Aerial Imagery in a Design-Friendly Way (Soren Walljasper) 
(@snwalljasper)
A very interesting talk given at the 2019 NACIS conference by Soren Walljasper (National Geographic) on using imagery to provide texture, detail, and landscape context on maps, while still maintaining clear visual hierarchy and legibility.

Edward Tufte and Graphics Press 
(@EdwardTufte)
Not specific to cartography, but Edward Tufte creates fantastic resources on data display and design, particularly in his book The Visual Display of Quantitative Information.


STYLE TEMPLATES


Stamen (@stamen)
Stamen has created several interesting maps styles that you can embed or use in other mapping systems as tiles.

North Star (by Nathaniel Slaughter)
A Mapbox style inspired by old nautical maps with a muted color palette.

Moonlight (by Rasagy Sharma) 
(@rasagy)
A Mapbox style. A minimal design for providing a high contrast backdrop for data visualizations or annotations. Uses just two shades of grey and a single type family.

Pencil (by Madison Draper) 
(@mzdraper)
A Mapbox style you can use to make maps that look like they’ve been rendered in pencil.

Decimal (by Tristen Brown)
A dark, minimalist Mapbox style reminiscent of an old mechanical control panel.


INSPIRATION


Atlas of Design (@NACIS_Atlas)
The Atlas of Design publishes a new volume of maps selected from a worldwide competition every two years. Four volumes have been published and volume will be released in 2020. You can see examples from each volume on this site.


Mapbox Map Design Blog
This blog features articles on styles created in Mapbox written by the designer of the style. The designer outlines some of the techniques that they used to create the style. There is often a link to add the style to your Mapbox account, and sometimes a step-by-step tutorial is provided on how the style was built.

CaGIS Annual Map Design Competition 
(@cartographyGIS)
The Cartography and Geographic Information Society holds an annual student and professional design competition. Galleries of past winning designs can be found here.

Kenneth Field 
(@kennethfield)
Kenneth Field is a cartographer and geographer with a blog that offers map info, opinions, and critiques. He complies his favorite maps yearly: 2019, 2018, 2017, 2016.

Beautiful Maps
A tumblr collection of maps.

Mapmania
A database of maps collected from reddit and Wikipedia. Each map has a score that shows its popularity. You can browse maps by tags or view random maps.

Thursday, April 16, 2020

Night Shift

Some of the illustrations I did for the companion lyric booklet to Jenny Owen Youngs' EP Night Shift.


Buddish


I completed 52 illustrations for Buddish, a card deck that encapsulates key Buddhist concepts (published in 2020). A few of the drawings are below:


Rare Species of Mt. Tom (2018)

I completed this large-scale (26 x 19”) ink drawing in 2018 of the endangered, threatened, and special concern species that can be found on Mt. Tom State Reservation in Massachusetts.

A companion booklet includes a natural history of Mt. Tom and shows details of the drawing with brief descriptions of each species illustrated. A foldout of the entire drawing is included.

You can also check out this project in story map form.


Garlic Mustard (2018)


Illustrations for a pamphlet on management of the invasive species garlic mustard (Alliaria petiolata). Download a copy here.